'Watershed Monitoring' with GIS:
Watershed Planning is performed using GIS, is discussed above.
The Watershed
Monitoring using the GIS and remote sensing is also done The exercise of Monitoring requires Pre-Implementation and Post-Implementation scenes.
The sites where structures are created are checked for impact made by these ones. There may be lot of land use changes, and added vegetation, water body, etc.
These activities at the time of Action Plan matched with the Final post-project scene make it clear as to how far has the Watershed project succeeded and what more could be done.
The GIS and Remote Sensing based watershed monitoring

Watershed monitoring using Satellite data and GIS technques is the only method for fool proof evaluation of a watershed implemented. The technique of a third party evaluating watershed programme is no more adopted many times gives a biased assessment. Satellite data reveals in black and white the actual impacts generated on the ground as also the exact images of structures and works carried out are shown.
An exercise was carried out under an assignment for the Watershed Mission, Government of Madhya Pradesh by NCHSE through WALMI. This work involved assessment of impact of watershed after 7 years period with reference to action plan enacted. The pre-project scenario of area as seen in Satellite data is compared with post project scenario on the ground after about 7 years as seen in satellite data as also verified on the ground. The method revealed the extent of success of watershed implemented by field organization. Result: ‘A fair assessment for watershed mission’.
Project area: Distt: Dhat, Block: Nalcha Miliwatershed No.: 5D2B2A and 5D2A8E
Microwatershed: Kothishodhpur.
Selected samples of a micro-watershed are being presented here to understand as to how the exercise is carried out:.
Slide 1:
Satellited data from where the small area is extracted that relates to
micro-watershed.
Slide 2:
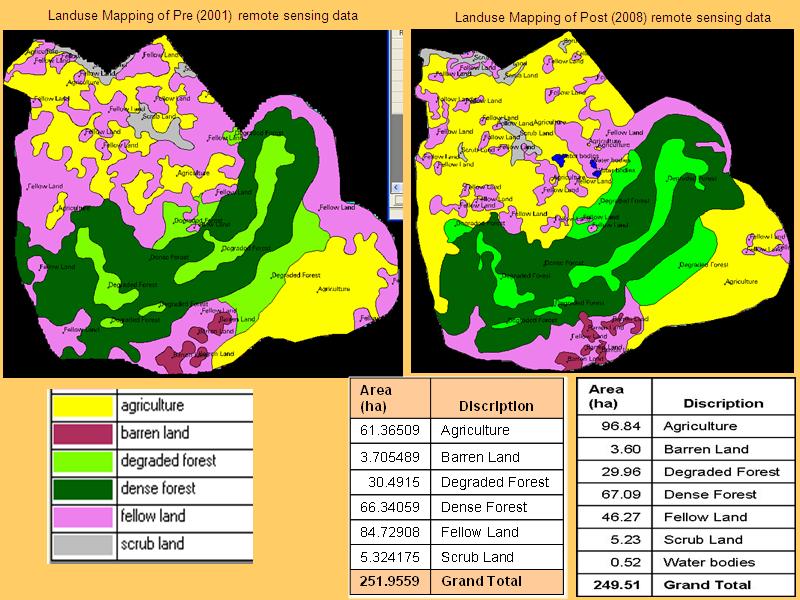
Satellited data of two periods - pre-porject time and post-project time is interpreted.The features like landuse, drainage etc. for that micro-watershed are extracted.
The year 2001 data interpreted.
The year 2008 data interpreted.
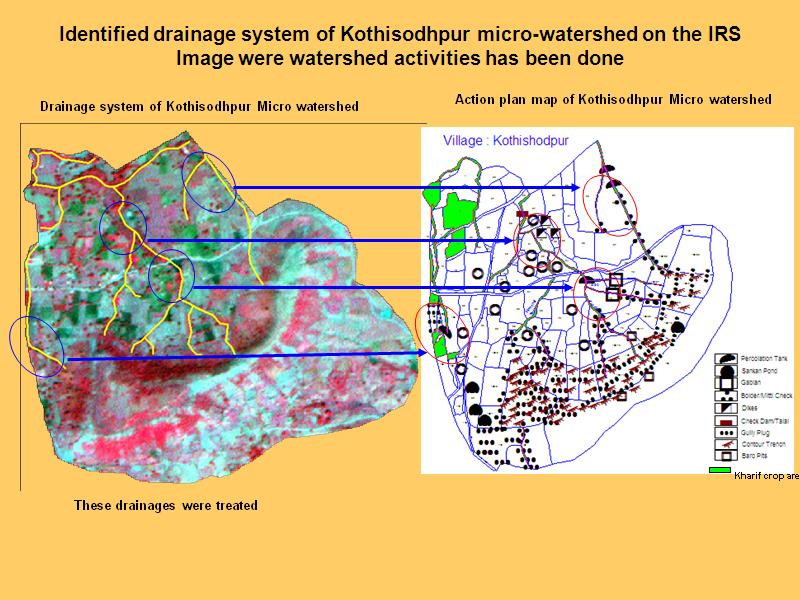
Slide 3:
Satellited data interpreted scenes for the year 2001 and year 2008 seen side by side. This helps to make quick judgement about the changes in the areas.
Slide 4:
The quantification done using GIS helped to make quick judgement about the changes in the area figures over the years as a result of the impact of the watershed programme.
Slide 5:
The GIS maps of the areas of the two periods based on satellited data, are superimposed with the action plans. The changes brout out are now seen with reference to activities implemented. Clearly the impact of all interventions are thus verifiable.
It may be concluded
there cannot be any other method than this
to make a fair assessment of results of a watershed or rural development programme.
 ...click here to Read the detailed
document of report in PDF format.

| |
|
A map is worth thousands words.
Showcase your Activities and also highlight their impacts on ground.
(To enlarge image, put cursor over the image) |
| |
|
Showcase the pre-project and post-project scenes of the area. It best tells, what good changes have been brought out by your project.
(To enlarge image, put cursor over the image) |

Contact persons:
Mr.Avinash Shrivastava (+91-9406528098)
Mr. Praveen Sharma (+91-9893170501) |
Office Phones:_91-0755-2463731, 4277074.
Fax: : _91-0755-2465651 |
Postal address:
National Centre for Human Settlements and Environment (NCHSE),
E-5/A, Girish Kunj, Arera Colony, BHOPAL. 426016. INDIA. |