Understanding maps

|
|
GIS on
madhya pradesh |
| Links and Text on Understanding maps |
|
|
This page offers discrete matter on Maps and
Mapping along with links to various useful sites on Maps . A potential GISer or
GIS user, would like to (and must) know about different types of Maps and
mapping products. This is rather a long collection, built now and would continue
to build, as it would take the reader from basics to interesting facts about
maps, to maps commonly used in India, to familiarisation with terms and
jargons used in Mapping and GIS disciplines and so
on. The mater presented here on this section is with sole intention of education and awareness generation. This is placed here with no commercial intentions or interest whatsoever. |
| FINDING
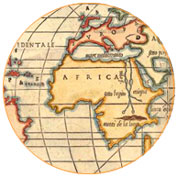
HISTORY of Maps
The map is one of the oldest forms of nonverbal communication. Humans were probably drawing maps before they were writing texts. Mapmaking may even predate formal language. As far as historians and geographers can determine, every culture in every part of the world uses and makes maps. This deep lineage reflects the descriptive usefulness of a map—a map is one of the best proofs that a “picture is worth a thousand words.” (It is an interesting WebSite .... Read on with Next button > on this site and enjoy.)
http://chnm.gmu.edu/worldhistorysources/unpacking/mapsmain.html |
|
| Learning
about Maps: The Primary Session
WHAT IS A MAP? A map is a picture or representation of the Earth's surface, showing how things are related to each other by distance, direction, and size. Maps are a way of showing many things about a portion of the earth's surface on a flat piece of paper ... An interesting WebSite like a tutorial discussing basics about maps and globe. http://msnucleus.org/membership/html/jh/earth/mapstype/index.html |
|
| Types Maps:
The Primary Session
TOPOGRAPHIC MAPS
Topographic maps show a 3 dimensional world in 2
dimensions by using contour lines. Many people have trouble reading
these maps, because they have mountains and valleys are represented with concentric
circles and... An interesting WebSite like a tutorial discussing basics different types of maps. http://msnucleus.org/membership/html/jh/earth/mapstype/lesson1/mapstypes01c.html
|
||
Types Maps: Session II:Physical mapsPhysical maps show the earth's landforms and bodies of water. The maps use lines, shading, tints, spot elevations, and different colors to show elevation and distinguish the mountains from the lowlands.This kind of map often has some road, city and cultural information but mostly functions as a view of the land surface. Often these maps make very attractive framed pieces for the den or office. Political mapsPolitical maps show boundaries that divide one political entity from another, such as townships, counties, cities, and states. Some maps emphasize the boundaries by printing the areas of each political division in different colors, for example world maps usually show each country in a different color.A political map can be made of any area from the local county, municipal levels all the way up to the world level. In general, most maps are political with far fewer being produced as physical maps. Relief maps: Shaded Relief and Raised ReliefRelief maps are maps that show relief data using contour lines, colors, and/or shading to evidence the elevation.Shaded relief maps show topographic features by using shading to simulate the appearance of sunlight and shadows. Steep mountains will have dark shadows, while flat lands will have no shadows. Raised-relief maps are three-dimensional plastic or vinyl maps portraying the physical features of a region. Raised relief maps can have as much as 2-3 inches of vertical relief, while this type of map is neat to look at they are all but impossible to ship so we cannot offer them on this site. In fact we rarely carry them in our store as we had upwards of 50% of them arrive in the "flattened relief" condition. Topographic mapsTopographic maps, often shortened to "topo maps" feature contour lines to portray the shape and elevation of the land. Topo maps render the three-dimensional ups and downs of the terrain on a two-dimensional surface. These maps use "contour lines" (lines of equal elevation) to show elevation. Lines that are close together indicate steep terrain, while lines far apart indicate flat terrain.Such maps also usually portray both natural and artificial features. They show and name works of nature including mountains, valleys, plains, lakes, rivers, and vegetation. They also identify selected man-made features, such as roads, boundaries, transmission lines, and major buildings. Topo maps are usually made in scales from 1:24,000 up to 1:250,000 but are occasionally available at scales of 1:500,000 or even 1:1million in the case of aeronautical charts.
|
||
| Types Maps:
Session III:
Planimetric Map. A planimetric map presents only the horizontal positions for the features represented. It is distinguished from a topographic map by the omission of relief, normally represented by contour lines. Sometimes, it is called a line map. Topographic Map. A topographic map portrays terrain features in a measurable way, as well as the horizontal positions of the features represented. The vertical positions, or relief, are normally represented by contour lines on military topographic maps. On maps showing relief, the elevations and contours are measured from a specific vertical datum plane, usually mean sea level. Photomap. A photomap is a reproduction of an aerial photograph upon which grid lines, marginal data, place names, route numbers, important elevations, boundaries, and approximate scale and direction have been added. Photomosaic. A photomosaic is an assembly of aerial photographs that is commonly called a mosaic in topographic usage. Mosaics are useful when time does not permit the compilation of a more accurate map. The accuracy of a mosaic depends on the method employed in its preparation and may vary from simply a good pictorial effect of the ground to that of a planimetric map. Terrain Model. A terrain model is a scale model of the terrain showing features, and in large-scale models showing industrial and cultural shapes. It provides a means for visualizing the terrain for planning or indoctrination purposes and for briefing on assault landings. Special Maps. Special maps are for special purposes such as trafficability, communications, and assault maps. They are usually in the form of an overprint in the scales smaller than 1:100,000 but larger than 1:1,000,000. A special purpose map is one that has been designed or modified to give information not covered on a standard map. The wide range of subjects that could be covered under the heading of special purpose maps prohibits, within the scope of this manual, more than a brief mention of a few important ones. Some of the subjects covered are:
Geographic Maps. Geographic maps provide an overall idea of the mapped area in relation to climate, population, relief, vegetation, and hydrography. They also show the general location of major urban areas. Tourist Road Maps. Tourist road maps are maps of a region in which the main means of transportation and areas of interest are shown. Some of these maps show secondary networks of roads, historic sites, museums, and beaches in detail. They may contain road and time distance between points. The scale should be carefully considered when using these maps. City/Utility Maps. City/utility maps are maps of urban areas showing streets, water ducts, electricity and telephone lines, and sewers. Field Sketches. Field sketches are preliminary drawings of an area or piece of terrain. Aerial Photographs. Aerial photographs can be used as map supplements or substitutes to help you analyze the terrain, plan your route, or guide your movement.
|
| SCIENCE OF MAP PROJECTION | ||||||||||||||||||
| A map is a representation of a place.
Distortion of Reality: projections Maps may show the world, or a
part of it. Cartographers do their best to make a good representation of
an area, but still every map contains some distortions of reality. One of
the reasons for these distortions is the fact that Earth is a sphere. You
can map the world on a small sphere; then you would have made a globe. But
if you want to draw the world on a regular map, that is, on a flat piece
of paper, it is imposible to do so without distorting reality!
Imagine you have peeled an orange. If you want to fix the peel onto a
piece of cardboard, it will crinkle in some places, and it will be
stretched in other places. Cartographers encounter the same problem in
mapmaking. The particular mathematical way that mapmakers choose to fix
'the peel' of the Earth on a piece of paper is called a projection. All
flat maps have to use a projection to display the spherical earth. Maps usually also contain distortions, that mapmakers add on purpose.
They do so to make the map more legible. An example is the way that rivers
are drawn into maps. In reality, most rivers are winding themselves
through the landscape with many curves. A lot of these curves you won't
find on the map, because it just wouldn't fit. The extent to which reality
is simplified on the map depends of course on the map scale. A small-scale
map shows less detail than a large-scale map. Another example are roads
and houses. Roads are often relatively wider on the map than in reality;
otherwise the lines would be so thin, you would hardly notice them! For
the same reason, detached house are often grouped and drawn as blocks of
houses.
Projections: Maps are called projections because map-makers have to project a 3-D surface onto a 2-D map. A projection is a representation of one thing onto another, such as a curved 3-Dimensional surface (like the Earth) onto a flat 2-Dimensional map. There are 3 major types of projections: cylindrical, conic, and planar. Since a map is 2-dimensional representation of a 3-dimensional world, compromises must be made in accuracy (some information must be lost when one dimension is ignored). Different maps differ in the relative accuracy of the depiction of the area, the shapes of objects, actual distances, and compass direction. Maps that focus on maintaining one feature (like preserving distance) must distort other features (like area, shape and compass directions). Maps that accurately reflect area are often called equal-area maps (an example is the Albers equal-area conic map). Maps that maintain the shape of objects are called conformal. Maps that correctly show the distance between points are often called equi-distant maps (note that the shortest distance between two points on a map is generally not a straight line. but a curve). Navigational maps need accurate compass directions maintained on the map (like the Mercator map). Related Terms:
|
| Scale
It is unfeasible to depict an
area on a map with its real size. Therefore, the area has to be reduced to
fit the size of the map. The ratio to which the size of the area has been
reduced is indicated by the scale of the map. Thus, scale is the
relationship between distance on the map and distance on the ground. A map
scale might be given in a drawing (a graphic scale), or by a ratio, such
as 1:25,000 or 1:100,000 (measured in centimeters!!). A map with a scale
of 1:100,000 shows an area that has been scaled down 100,000 times!
The scale that a cartographer chooses to use for his map depends on the
purpose of that map. A city map, for example, has to contain many details.
Therefore, the map should not be scaled down too much. Often, a scale of
1:15,000 (one centimeter on the map is 150 meter in reality) is
used for such a map. A map like that is called a large-scale map.
Maps that have a scale smaller than 1:100,000 are called small-scale
maps. Small-scale maps are less detailed, since they show a larger area
than a large-scale map.
A scale gives information about the relation between a distance on a
map, and the distance in reality. If you now this ratio, then you can
calculate the 'real' distance between two points on a map. For example, we
measure a road on a map. Let's say it is 2.5 centimetres long. In the case
of a scale of 1:100,000, we know that 1 centimetre on the map is 1
kilometre in reality (100,000 centimetres equal 1 kilometre). The road
that we measured therefore must be 2,5 kilometres.
Scale and MapsMaps are smaller than reality - map scales describe how much smaller.It has been said that a map is important to a geographer in a similar way as a microscope is important to a biologist. A microscope enables the biologist to describe the structure of cells, a map by generalising the characteristics of an area allows a geographer to describe the composition of that area. This section mainly discusses the explicit effects of scale, but map users should also be aware of implicit effects. Map scales can be shown in 2 ways: 1:25 000or a graphical representation There are various different style of scalebars. In general the horizontal length of the bar represents a certain length on the ground, for example 1km or 5km. Frequently scalebars include tick marks to show intermediate distances. Both ratios and scalebars are useful for different purposes.
Measuring Distances on a Map: Map ScaleA map represents a portion of the earth's surface. Since an accurate map represents the land, each map has a "scale" which indicates the relationship between a certain distance on the map and the distance on the ground. The map scale is usually located in the legend box of a map, which explains the symbols and provides other important information about the map. A map scale can be printed in a variety of ways. A ratio or representative fraction (RF) indicates how many units on the earth's surface is equal to one unit on the map. It can be expressed as 1/100,000 or 1:100,000. In this example, one centimeter on the map equals 100,000 centimeters (1 kilometer) on the earth. It also means that one inch on the map is equal to 100,000 inches on the land (8,333 feet, 4 inches or about 1.6 miles). A word statement gives a written description of map distance, such as "One centimeter equals one kilometer" or "One centimeter equals ten kilometers." Obviously, the first map would show much more detail than the second because one centimeter on the first map covers a much smaller area then on the second map. The first two methods of indicating map distance would be ineffective if the map is reproduced by a method such as photocopying and the size of the map is modified. If this occurs, and one attempts to measure an inch on the modified map, it's not the same as an inch on the original map. A graphic scale does solve this problem because it is simply a line marked with distance on the ground which the map user can use along with a ruler to determine scale on the map. In the U.S., a graphic scale often includes both metric and U.S. common units. As long as the size of the graphic scale is changed along with the map, it will be accurate. Maps are often known as large scale or small scale. A large scale map refers to one which shows greater detail because the representative fraction (e.g. 1/25,000) is a larger fraction than a small scale map which would have an RF of 1/250,000 to 1/7,500,000. Large scale maps will have a RF of 1:50,000 or greater (i.e. 1:10,000). Those between 1:50,000 to 1:250,000 are maps with an intermediate scale. Maps of the world which fit on two 8 1/2 by 11 inch pages are very small scale, about 1 to 100 million. There is lot more to see on this very informative Website: http://geography.about.com/cs/maps/
The scale of a map is the ratio of a single unit of distance on the map to the equivalent distance on the ground. The scale can be expressed in four ways: as a ratio, a fraction, in words and as a graphical (bar) scale. A scale expressed as a ratio of say 1:25,000 means that one unit on the map represents 25,000 units on the ground, ie 1 millimetre represents 25,000 mm, expressed better as 25 metres. The statement 'one millimetre represents 25 metres' is an expression of scale in words. Scale expressed as a fraction, 1/25,000, means that any distance on the map is 1/25,000 th the distance on the ground. It expresses the amount of reduction of distances used to represent detail on the map. The 25,000 value is called the scale denominator. Due to showing the curved surface of the earth on a flat map surface, the scale varies from place to place. Thus a representative fraction is stated for scale which is correct at the centre of the map and which varies elsewhere. While called representative fraction, it really is the representative ratio. A graphical (bar) scale is a ruler with ground distances added, included in the margin of most maps. The graphical scale is used to measure distances on the map. The distance on the map is marked on the edge of a sheet of paper, which is then placed over the graphical bar scale and the distance read. Maps are usually produced at standard scales of (say) 1:10,000, 1:25,000, 1:50,000, 1:100,000, 1:250,000, 1:500,000. The distance on the ground equals the distance measured on the map multipled by the scale denominator. Calculation: Measure 466 mm on a map with scale 1:50,000
466 x 50,000 = 23,300,000 mm
ie 23,300 metres
ie 23.3 kilometres
Some older maps use imperial units expressed in words, such as 60 chains to 1 inch or 2 miles to 1 inch, etc. In this case measure mm on the map and multiply by the scale factor below (where 1 yard = 36 inches, 1 chain = 22 yards) ... 40 chains = 1 inch >> 40 x 22 x 36 >> 1 : 31,680 (scale) 60 chains = 1 inch >> 60 x 22 x 36 >> 1 : 47,520 (scale) 1 mile = 1 inch >> 63,360 x 1 >> 1 : 63,360 (scale) 2 miles = 1 inch >> 63,360 x 2 >> 1 : 126,720 (scale) 4 miles = 1 inch >> 63,360 x 4 >> 1 : 253,440 (scale) Calculation: Measure 132 mm on a map with scale 60 chains to 1 inch
132 x 47,520 = 6272,640 milimetres
ie 6,272.6 metres
ie 6.27 kilometres
Maps are sometimes referred to by relative descriptions of large scale or small scale. A large scale map displays objects so they appear relatively large. For example, an island displayed on a 1:10,000 map will appear larger than if displayed on a 1:100,000 map. Thus, the former is large scale. Maps with a ratio of 1:50,000 or larger (for example, 1:25,000 would be larger) are considered large scale. Maps with a ratio of 1:50,000 to 1:250,000 are considered medium scale. Any maps with a smaller scale (for example 1:500,000) are considered small scale. There is lot more to see on this very informative Website: http://en.wikipedia.org/wiki/Scale_(map) |
|
|
||
| Cadastre
A cadastre (also spelled cadaster) is a comprehensive register of the real property of a country, and commonly includes details of the ownership, the tenure, the precise location, the dimensions (and area) and the value of individual parcels of land. The word came into English by way of French and Italian, variously attributed to the Late Latin capitastrum, a register of the poll tax, and the Greek κατάστιχον [katastikhon], a list or register, from κατά στίχον [kata stikhon], literally, "down the line", in the sense of "line by line." It gives rise to the adjective cadastral, used in public administration, primarily for ownership and taxation purposes. The terminology used for cadastral divisions may include counties, parishes, ridings, hundreds, sections, lots, and blocks.
Cadastral Surveys Cadastral surveys are used to document land ownership, by the production of documents, diagrams, sketches, plans (plats in USA), charts, and maps. They were originally used to ensure reliable facts for land valuation and taxation. An example from early England is the Domesday Book. Napoleon established a comprehensive cadastral system for France which is regarded as the fore-runner of most modern versions. Cadastral survey information is often a base element in Geographic/Land Information systems used to assess and manage land and built infrastructure. Such systems are also employed on a variety of other tasks, for example, to track long-term changes over time for geological or ecological studies, where land tenure is a significant part of the senario.
Cadastral Maps A cadastral map is a map showing the boundaries and ownership of land parcels. Some cadastral maps show additional details, such as survey district names, unique identifying numbers for parcels, Certificate of Title numbers, positions of existing structures, section and/or lot numbers and their respective areas, adjoining and adjacent street names, selected boundary dimensions and references to prior maps. In most countries legal systems have developed around the original administrative systems and use the cadastre as a means of defining the dimensions and location of land parcels described in legal documentation. This leads to the use of the cadastre as a fundamental source of data in disputes and lawsuits between landowners.
|
|
Types of maps: An NCERT text: http://72.14.235.104/search?q=cache:HKEbDqZ9GDgJ:www.ncert.nic.in/textbooks/XI/Work_of_geo_XI/chapter1.pdf+types+of+maps&hl=en&ct=clnk&cd=23&gl=in
|
||
NRSA
- National Remote Sensing Agency
Remote Sensing Product details.
How to Order them.